Note
Go to the end to download the full example code.
Driver specific plot styling
Create some plots and show the usage of fastf1.plotting.get_driver_style.
from matplotlib import pyplot as plt

import fastf1
from fastf1 import plotting


# Enable Matplotlib patches for plotting timedelta values and load
# FastF1's dark color scheme
fastf1.plotting.setup_mpl(mpl_timedelta_support=True, color_scheme='fastf1')
Load the race session.
race = fastf1.get_session(2023, "Azerbaijan", 'R')
race.load()
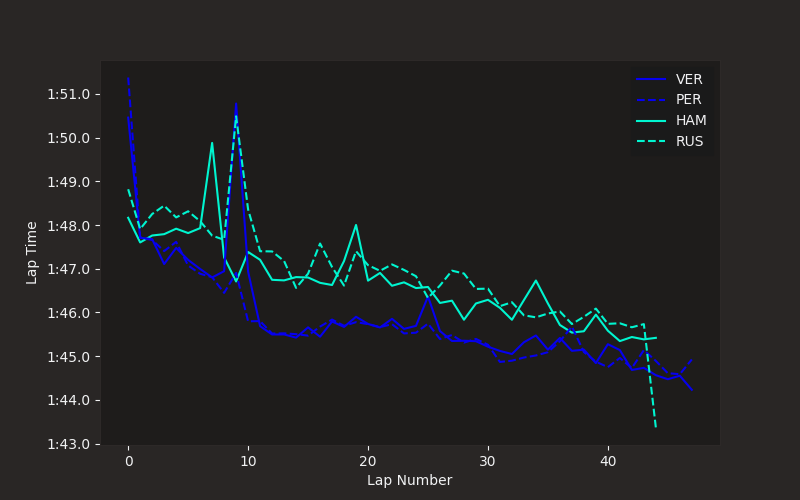
Basic driver-specific plot styling
Plot all the laps for Hamilton, Russel, Perez and Verstappen.
Filter out slow laps as they distort the graph axis.
Note: as LapTime is represented by timedelta, calling setup_mpl earlier
is required.
fig, ax = plt.subplots(figsize=(8, 5))

for driver in ('HAM', 'PER', 'VER', 'RUS'):
    laps = race.laps.pick_drivers(driver).pick_quicklaps().reset_index()
    style = plotting.get_driver_style(identifier=driver,
                                      style=['color', 'linestyle'],
                                      session=race)
    ax.plot(laps['LapTime'], **style, label=driver)

# add axis labels and a legend
ax.set_xlabel("Lap Number")
ax.set_ylabel("Lap Time")
ax.legend()

<matplotlib.legend.Legend object at 0x7f9572afefc0>
Sorting the legend
That plot looks pretty good already, but the order of the labels in the
legend is slightly chaotic. Instead of trying to order the labels manually,
use fastf1.plotting.add_sorted_driver_legend().
Let’s create the exact same plot again, but this time with a sorted legend
which means, we only change the very last function call.
fig, ax = plt.subplots(figsize=(8, 5))

for driver in ('HAM', 'PER', 'VER', 'RUS'):
    laps = race.laps.pick_drivers(driver).pick_quicklaps().reset_index()
    style = plotting.get_driver_style(identifier=driver,
                                      style=['color', 'linestyle'],
                                      session=race)
    ax.plot(laps['LapTime'], **style, label=driver)

# add axis labels and a legend
ax.set_xlabel("Lap Number")
ax.set_ylabel("Lap Time")
plotting.add_sorted_driver_legend(ax, race)
<matplotlib.legend.Legend object at 0x7f956e52d370>
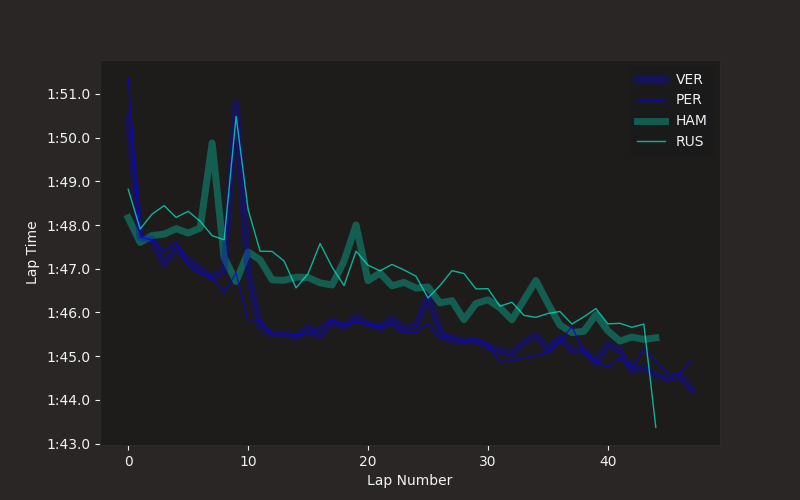
Creating fully custom styles
If you want to fully customize the plot style, you can define your own styling variants.
Note that the value 'auto' is treated as a magic keyword when used in
combination with a color. It will be replaced with the team color.
We define two styles, one for the first driver and one for the second driver in any team.
The plot that is generated here isn’t intended to be very readable, but it shows how you can customize any plot styling parameter.
my_styles = [
    # style for each first driver
    {'color': 'auto', 'linestyle': 'solid', 'linewidth': 5, 'alpha': 0.3},
    # style for each second driver
    {'color': 'auto', 'linestyle': 'solid', 'linewidth': 1, 'alpha': 0.7}
]

fig, ax = plt.subplots(figsize=(8, 5))

for driver in ('HAM', 'PER', 'VER', 'RUS'):
    laps = race.laps.pick_drivers(driver).pick_quicklaps().reset_index()

    # here, we now use ``style=my_style`` to use the custom styling
    style = plotting.get_driver_style(identifier=driver,
                                      style=my_styles,
                                      session=race)

    ax.plot(laps['LapTime'], **style, label=driver)

# add axis labels and a legend
ax.set_xlabel("Lap Number")
ax.set_ylabel("Lap Time")
plotting.add_sorted_driver_legend(ax, race)
plt.show()
Total running time of the script: (0 minutes 2.770 seconds)