
Note
Go to the end to download the full example code.
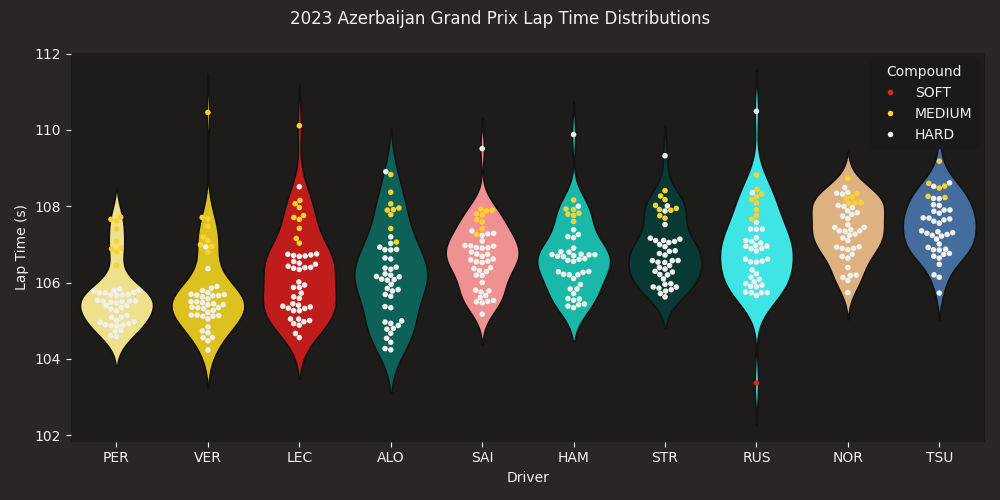
Driver Laptimes Distribution Visualization#
Visualize different drivers’ laptime distributions.
import seaborn as sns
from matplotlib import pyplot as plt

import fastf1
import fastf1.plotting


# Enable Matplotlib patches for plotting timedelta values and load
# FastF1's dark color scheme
fastf1.plotting.setup_mpl(mpl_timedelta_support=True, color_scheme='fastf1')
Load the race session
race = fastf1.get_session(2023, "Azerbaijan", 'R')
race.load()
Get all the laps for the point finishers only. Filter out slow laps (yellow flag, VSC, pitstops etc.) as they distort the graph axis.
point_finishers = race.drivers[:10]
print(point_finishers)
driver_laps = race.laps.pick_drivers(point_finishers).pick_quicklaps()
driver_laps = driver_laps.reset_index()
['11', '1', '16', '14', '55', '44', '18', '63', '4', '22']
To plot the drivers by finishing order, we need to get their three-letter abbreviations in the finishing order.
finishing_order = [race.get_driver(i)["Abbreviation"] for i in point_finishers]
print(finishing_order)
['PER', 'VER', 'LEC', 'ALO', 'SAI', 'HAM', 'STR', 'RUS', 'NOR', 'TSU']
First create the violin plots to show the distributions. Then use the swarm plot to show the actual laptimes.
# create the figure
fig, ax = plt.subplots(figsize=(10, 5))

# Seaborn doesn't have proper timedelta support,
# so we have to convert timedelta to float (in seconds)
driver_laps["LapTime(s)"] = driver_laps["LapTime"].dt.total_seconds()

sns.violinplot(data=driver_laps,
               x="Driver",
               y="LapTime(s)",
               hue="Driver",
               inner=None,
               density_norm="area",
               order=finishing_order,
               palette=fastf1.plotting.get_driver_color_mapping(session=race)
               )

sns.swarmplot(data=driver_laps,
              x="Driver",
              y="LapTime(s)",
              order=finishing_order,
              hue="Compound",
              palette=fastf1.plotting.get_compound_mapping(session=race),
              hue_order=["SOFT", "MEDIUM", "HARD"],
              linewidth=0,
              size=4,
              )
<Axes: xlabel='Driver', ylabel='LapTime(s)'>
Make the plot more aesthetic
ax.set_xlabel("Driver")
ax.set_ylabel("Lap Time (s)")
plt.suptitle("2023 Azerbaijan Grand Prix Lap Time Distributions")
sns.despine(left=True, bottom=True)

plt.tight_layout()
plt.show()
Total running time of the script: (0 minutes 3.310 seconds)
 Contribute