
Note
Go to the end to download the full example code.
Overlaying speed traces of two laps#
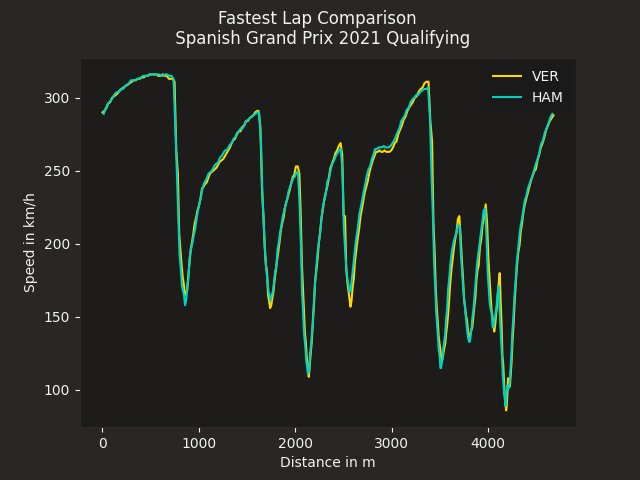
Compare two fastest laps by overlaying their speed traces.
import matplotlib.pyplot as plt

import fastf1.plotting


# Enable Matplotlib patches for plotting timedelta values and load
# FastF1's dark color scheme
fastf1.plotting.setup_mpl(mpl_timedelta_support=True, color_scheme="fastf1")

# load a session and its telemetry data
session = fastf1.get_session(2021, "Spanish Grand Prix", "Q")
session.load()
First, we select the two laps that we want to compare
ver_lap = session.laps.pick_drivers("VER").pick_fastest()
ham_lap = session.laps.pick_drivers("HAM").pick_fastest()
Next we get the telemetry data for each lap. We also add a ‘Distance’ column to the telemetry dataframe as this makes it easier to compare the laps.
ver_tel = ver_lap.get_car_data().add_distance()
ham_tel = ham_lap.get_car_data().add_distance()
Finally, we create a plot and plot both speed traces. We color the individual lines with the driver’s team colors.
rbr_color = fastf1.plotting.get_team_color(ver_lap["Team"], session=session)
mer_color = fastf1.plotting.get_team_color(ham_lap["Team"], session=session)

fig, ax = plt.subplots()
ax.plot(ver_tel["Distance"], ver_tel["Speed"], color=rbr_color, label="VER")
ax.plot(ham_tel["Distance"], ham_tel["Speed"], color=mer_color, label="HAM")

ax.set_xlabel("Distance in m")
ax.set_ylabel("Speed in km/h")

ax.legend()
plt.suptitle(f"Fastest Lap Comparison \n "
             f"{session.event['EventName']} {session.event.year} Qualifying")

plt.show()
Total running time of the script: (0 minutes 1.367 seconds)
 Contribute