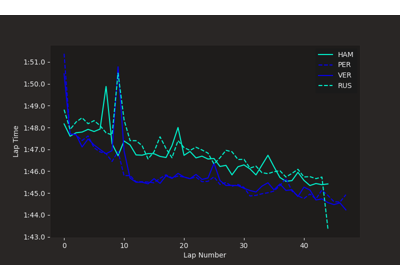
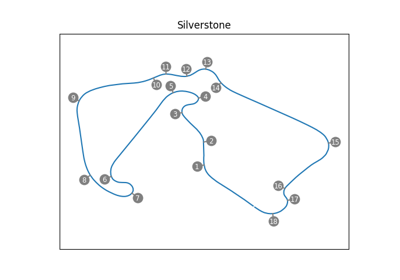
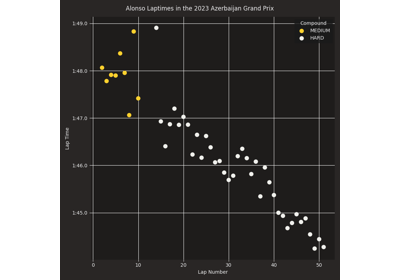
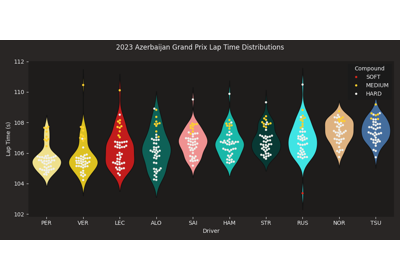
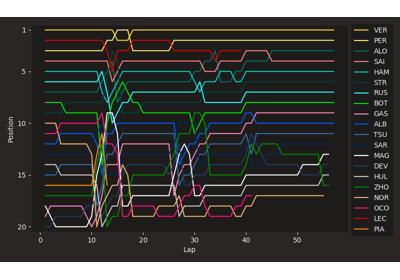
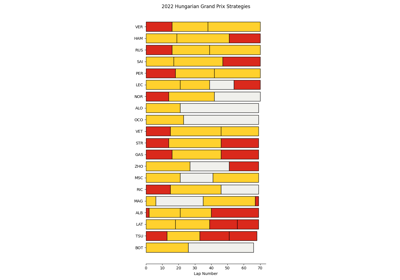
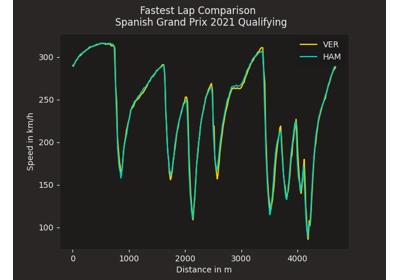
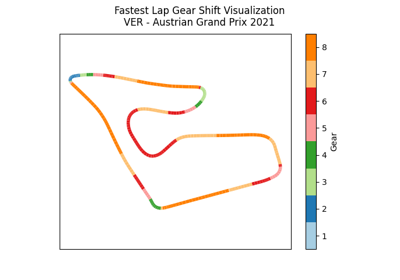
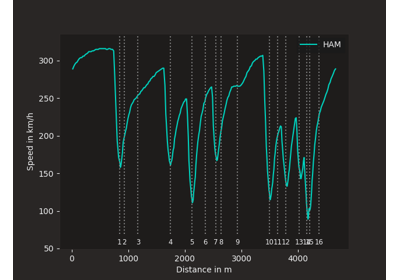
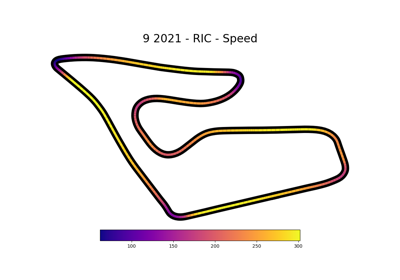
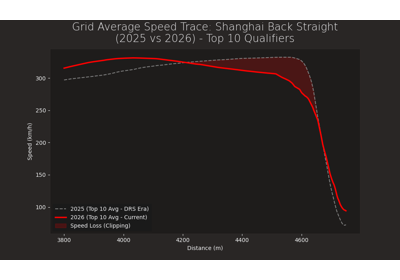
Contents Menu Expand Light mode Dark mode Auto light/dark, in light mode Auto light/dark, in dark mode Skip to content
FastF1 3.5.3
Logo
FastF1 3.5.3
  • ← Back to Github

Contents:

  • Getting Started
    • Getting started with the basics
  • Examples Gallery
    • Using the Fast-F1 signalr client?
    • Position changes during a race
    • Overlaying speed traces of two laps
    • Driver Laptimes Scatterplot
    • Gear shifts on track
    • Team Pace Comparison
    • Tyre strategies during a race
    • Qualifying results overview
    • Driver Laptimes Distribution Visualization
    • Plot speed traces with corner annotations
    • Who can still win the drivers WDC?
    • Speed visualization on track map
    • Driver specific plot styling
    • Draw a track map with numbered corners
    • Plot driver standings in a heatmap
  • General Functions - fastf1
  • Timing and Telemetry Data - fastf1.core
  • API Reference
  • Event Schedule - fastf1.events
  • F1 API - fastf1.api
  • Ergast API Interface
  • Circuit Information
  • Utils module - fastf1.utils
  • Plotting - fastf1.plotting
  • Live Timing Client - fastf1.livetiming
  • Logging - fastf1.logger
  • Legacy Functionality - fastf1.legacy

Information:

  • Time, Date and Timing - Explanation
  • How to perform calculations accurately
  • Troubleshooting
  • Contributing
    • Contributing
    • Setting up FastF1 for development
    • Testing
    • Writing documentation
    • Pull request guidelines
  • Release Notes
Back to top
View this page

Examples Gallery

Using the Fast-F1 signalr client?

Using the Fast-F1 signalr client?

Position changes during a race

Position changes during a race

Overlaying speed traces of two laps

Overlaying speed traces of two laps

Driver Laptimes Scatterplot

Driver Laptimes Scatterplot

Gear shifts on track

Gear shifts on track

Team Pace Comparison

Team Pace Comparison

Tyre strategies during a race

Tyre strategies during a race

Qualifying results overview

Qualifying results overview

Driver Laptimes Distribution Visualization

Driver Laptimes Distribution Visualization

Plot speed traces with corner annotations

Plot speed traces with corner annotations

Who can still win the drivers WDC?

Who can still win the drivers WDC?

Speed visualization on track map

Speed visualization on track map

Driver specific plot styling

Driver specific plot styling

Draw a track map with numbered corners

Draw a track map with numbered corners

Plot driver standings in a heatmap

Plot driver standings in a heatmap

Gallery generated by Sphinx-Gallery

Next
Using the Fast-F1 signalr client?
Previous
Getting started with the basics
Copyright © 2025, theOehrly
Made with Sphinx and @pradyunsg's Furo