Ctrl+K
FastF1 (3.7.0) - Home FastF1 (3.7.0) - Home
  • Getting Started
  • Examples Gallery
  • API Reference
  • Data Reference
  • Release Notes
    • Contributing
  • GitHub
  • Getting Started
  • Examples Gallery
  • API Reference
  • Data Reference
  • Release Notes
  • Contributing
  • GitHub

Section Navigation

  • Plot Styling
    • Driver specific plot styling
    • Draw a track map with numbered corners
  • Lap Time Analysis
    • Driver Laptimes Scatterplot
    • Driver Laptimes Distribution Visualization
  • Strategy and Results Analysis
    • Position changes during a race
    • Team Pace Comparison
    • Tyre strategies during a race
    • Qualifying results overview
  • Standings
    • Who can still win the drivers WDC?
    • Plot driver standings in a heatmap
    • Season Summary Visualization
  • Telemetry Analysis
    • Overlaying speed traces of two laps
    • Gear shifts on track
    • Plot speed traces with corner annotations
    • Speed visualization on track map
  • Examples Gallery
  • Plot Styling

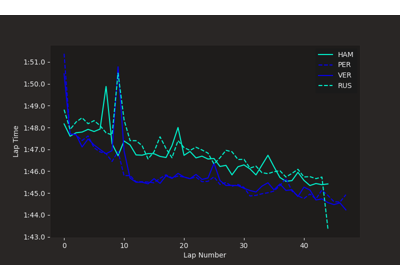
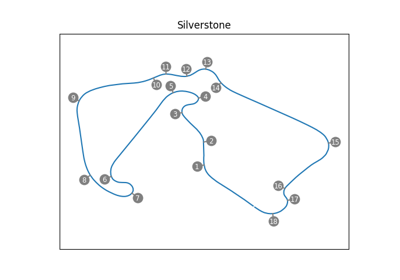
Plot Styling#

Driver specific plot styling

Driver specific plot styling

Draw a track map with numbered corners

Draw a track map with numbered corners

previous

Examples Gallery

next

Driver specific plot styling

Support the Project
Contribute Buy Me A Coffee

© Copyright 2025, Philipp Schäfer.

Created using Sphinx 8.2.3.

Privacy-Friendly Open-Source Web Analytics by GoatCounter

Built with the PyData Sphinx Theme 0.16.1.