Ctrl+K
FastF1 (3.7.0) - Home FastF1 (3.7.0) - Home
  • Getting Started
  • Examples Gallery
  • API Reference
  • Data Reference
  • Release Notes
    • Contributing
  • GitHub
  • Getting Started
  • Examples Gallery
  • API Reference
  • Data Reference
  • Release Notes
  • Contributing
  • GitHub

Section Navigation

  • Plot Styling
    • Driver specific plot styling
    • Draw a track map with numbered corners
  • Lap Time Analysis
    • Driver Laptimes Scatterplot
    • Driver Laptimes Distribution Visualization
  • Strategy and Results Analysis
    • Position changes during a race
    • Team Pace Comparison
    • Tyre strategies during a race
    • Qualifying results overview
  • Standings
    • Who can still win the drivers WDC?
    • Plot driver standings in a heatmap
    • Season Summary Visualization
  • Telemetry Analysis
    • Overlaying speed traces of two laps
    • Gear shifts on track
    • Plot speed traces with corner annotations
    • Speed visualization on track map
  • Examples Gallery
  • Telemetry Analysis

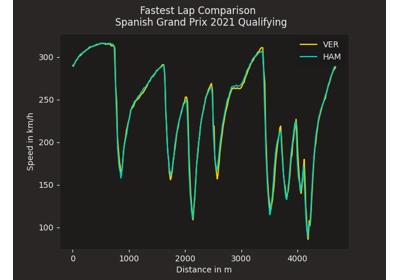
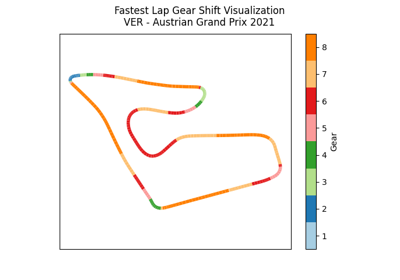
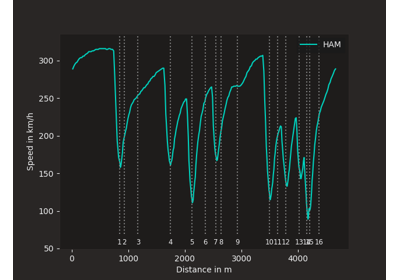
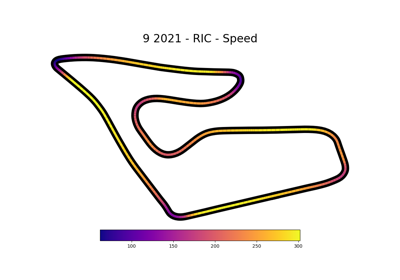
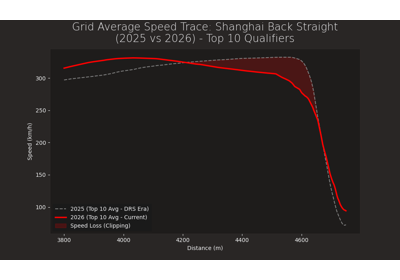
Telemetry Analysis#

Overlaying speed traces of two laps

Overlaying speed traces of two laps

Gear shifts on track

Gear shifts on track

Plot speed traces with corner annotations

Plot speed traces with corner annotations

Speed visualization on track map

Speed visualization on track map

previous

Season Summary Visualization

next

Overlaying speed traces of two laps

Support the Project
Contribute Buy Me A Coffee

© Copyright 2025, Philipp Schäfer.

Created using Sphinx 8.2.3.

Privacy-Friendly Open-Source Web Analytics by GoatCounter

Built with the PyData Sphinx Theme 0.16.1.