Note
Go to the end to download the full example code.
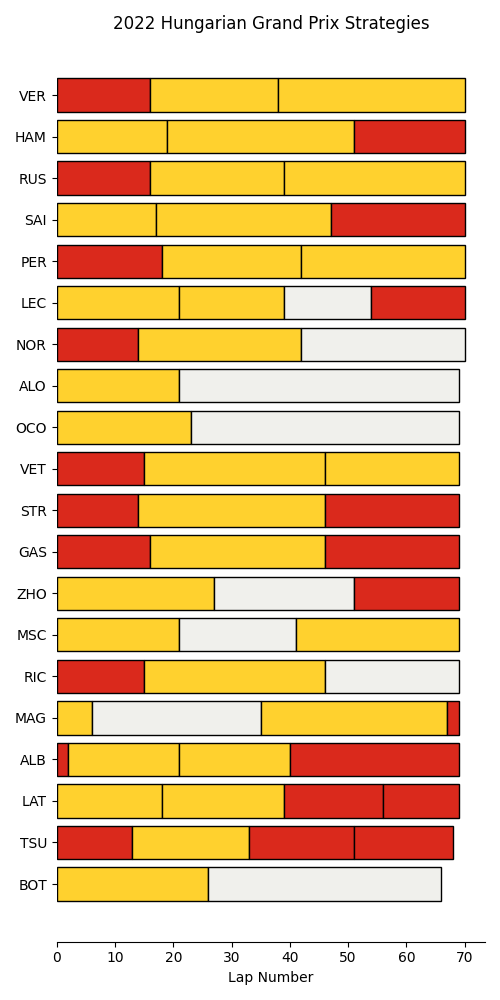
Tyre strategies during a race
Plot all drivers’ tyre strategies during a race.
from matplotlib import pyplot as plt

import fastf1
import fastf1.plotting
Load the race session
session = fastf1.get_session(2022, "Hungary", 'R')
session.load()
laps = session.laps
Get the list of driver numbers
drivers = session.drivers
print(drivers)
['1', '44', '63', '55', '11', '16', '4', '14', '31', '5', '18', '10', '24', '47', '3', '20', '23', '6', '22', '77']
Convert the driver numbers to three letter abbreviations
drivers = [session.get_driver(driver)["Abbreviation"] for driver in drivers]
print(drivers)
['VER', 'HAM', 'RUS', 'SAI', 'PER', 'LEC', 'NOR', 'ALO', 'OCO', 'VET', 'STR', 'GAS', 'ZHO', 'MSC', 'RIC', 'MAG', 'ALB', 'LAT', 'TSU', 'BOT']
We need to find the stint length and compound used for every stint by every driver. We do this by first grouping the laps by the driver, the stint number, and the compound. And then counting the number of laps in each group.
stints = laps[["Driver", "Stint", "Compound", "LapNumber"]]
stints = stints.groupby(["Driver", "Stint", "Compound"])
stints = stints.count().reset_index()
The number in the LapNumber column now stands for the number of observations in that group aka the stint length.
stints = stints.rename(columns={"LapNumber": "StintLength"})
print(stints)
   Driver  Stint Compound  StintLength
0     ALB    1.0     SOFT            2
1     ALB    2.0   MEDIUM           19
2     ALB    3.0   MEDIUM           19
3     ALB    4.0     SOFT           29
4     ALO    1.0   MEDIUM           21
..    ...    ...      ...          ...
57    VET    2.0   MEDIUM           31
58    VET    3.0   MEDIUM           23
59    ZHO    1.0   MEDIUM           27
60    ZHO    2.0     HARD           24
61    ZHO    3.0     SOFT           18

[62 rows x 4 columns]
Now we can plot the strategies for each driver
fig, ax = plt.subplots(figsize=(5, 10))

for driver in drivers:
    driver_stints = stints.loc[stints["Driver"] == driver]

    previous_stint_end = 0
    for idx, row in driver_stints.iterrows():
        # each row contains the compound name and stint length
        # we can use these information to draw horizontal bars
        plt.barh(
            y=driver,
            width=row["StintLength"],
            left=previous_stint_end,
            color=fastf1.plotting.COMPOUND_COLORS[row["Compound"]],
            edgecolor="black",
            fill=True
        )

        previous_stint_end += row["StintLength"]
Make the plot more readable and intuitive
plt.title("2022 Hungarian Grand Prix Strategies")
plt.xlabel("Lap Number")
plt.grid(False)
# invert the y-axis so drivers that finish higher are closer to the top
ax.invert_yaxis()
Plot aesthetics
ax.spines['top'].set_visible(False)
ax.spines['right'].set_visible(False)
ax.spines['left'].set_visible(False)

plt.tight_layout()
plt.show()
Total running time of the script: (0 minutes 5.895 seconds)