Plotting - fastf1.plotting
Helper functions for creating data plots.
fastf1.plotting provides optional functionality with the intention of
making it easy to create nice plots.
- This module mainly offers:
team names and colors
driver names and driver abbreviations
Matplotlib integration and helper functions
FastF1 focuses on plotting with Matplotlib or related libraries like Seaborn.
If you wish to use these libraries, it is highly recommended to enable
extend support for these by calling setup_mpl().
Team Colormaps
Currently, two team colormaps are supported. Each colormap provides one color
for each team. All functions that return colors for teams or drivers accept an
optional colormap argument. If this argument is not provided, the default
colormap is used. The default colormap can be changed by using
set_default_colormap().
The 'fastf1' colormap is FastF1’s default colormap. These colors are teams’
primary colors or accent colors as they are used by the teams on their website
or in promotional material. The colors are chosen to maximize readability in
plots by creating a stronger contrast while still being associated with the
team. Colors are constant over the course of a season.
The 'official' colormap contains the colors exactly as they are used by
F1 in official graphics and in the TV broadcast. Those colors are often
slightly muted. While that makes them more pleasing to look at in some graphics,
it also reduces the contrast between colors which is often bad for
readability of plots. These colors may change during the season if they are
updated by F1.
See here for a complete list of all colors: Overview over Team Colormaps
Note
Driver Colors
Previously, individual colors for each driver were provided. This is no longer the case. The driver color is now equivalent to the team color, meaning that drivers from the same team have the exact same color. This change was made because different colors for 20 drivers end up looking very similar in a lot of cases. Therefore, it is not a good solution to use driver specific colors to distinguish between different drivers. Other means of plot styling should be used instead.
Overview
Configuration and Setup
Functions:
|
Setup matplotlib for use with fastf1. |
Get Colors, Names and Abbreviations for Drivers or Teams
Functions:
|
Get the compound color as hexadecimal RGB color code for a given compound. |
|
Get a driver's abbreviation based on a recognizable and identifiable part of the driver's name. |
|
Get a list of abbreviations of all drivers that drove for a team in a given session based on a recognizable and identifiable part of the team name. |
|
Get the color that is associated with a driver based on the driver's abbreviation or based on a recognizable and identifiable part of the driver's name. |
|
Get a full driver name based on the driver's abbreviation or based on a recognizable and identifiable part of the driver's name. |
|
Get a list of full names of all drivers that drove for a team in a given session based on a recognizable and identifiable part of the team name. |
|
Get a plotting style that is unique for a driver based on the driver's abbreviation or based on a recognizable and identifiable part of the driver's name. |
|
Get a team color based on a recognizable and identifiable part of the team name. |
|
Get a full or shortened team name based on a recognizable and identifiable part of the team name. |
|
Get a full team name based on a driver's abbreviation or based on a recognizable and identifiable part of a driver's name. |
List all Names and Abbreviations for Drivers/Teams in a Session
Functions:
|
Returns a dictionary that maps compound names to their associated colors. |
|
Returns a dictionary that maps driver abbreviations to their associated colors. |
|
Returns a list of all compound names for this season (not session). |
|
Returns a list of abbreviations of all drivers in the |
|
Returns a list of full names of all drivers in the |
|
Returns a list of team names of all teams in the |
Plot Styling
Functions:
|
Adds a legend to the axis where drivers are grouped by team and within each team they are shown in the same order that is used for selecting plot styles. |
|
Set the default colormap that is used for color lookups. |
Advanced Functionality
Functions:
|
Override the default team constants for a specific team. |
Deprecated Functionality
The following module-level attributes are deprecated since version 3.4.0 and will be removed in a future release.
Plotting API Reference
- fastf1.plotting.add_sorted_driver_legend(ax, session, *args, **kwargs)[source]
Adds a legend to the axis where drivers are grouped by team and within each team they are shown in the same order that is used for selecting plot styles.
This function is a drop-in replacement for calling Matplotlib’s
ax.legend()method. It can only be used when driver names or driver abbreviations are used as labels for the legend.This function supports the same
*argsand**kwargsas Matplotlib’sax.legend(), including thehandlesandlabelsarguments. Check the Matplotlib documentation for more information.There is no particular need to use this function except to make the legend more visually pleasing.
- Parameters:
ax (
Axes) – An instance of a MatplotlibAxesobjectsession (
Session) – the session for which the data should be obtained*args – Matplotlib legend args
**kwargs –
Matplotlib legend kwargs
- Returns:
matplotlib.legend.Legend
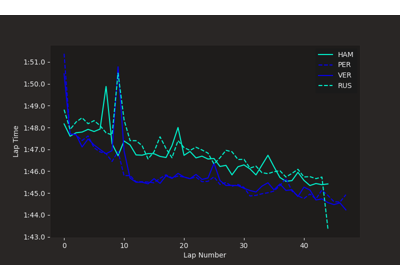
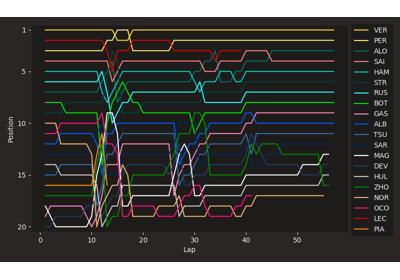
Examples using
fastf1.plotting.add_sorted_driver_legend
- fastf1.plotting.get_compound_color(compound, session)[source]
Get the compound color as hexadecimal RGB color code for a given compound.
- Parameters:
compound (
str) – the name of the compoundsession (
Session) – the session for which the data should be obtained
- Return type:
str- Returns:
A hexadecimal RGB color code
- fastf1.plotting.get_compound_mapping(session)[source]
Returns a dictionary that maps compound names to their associated colors. The colors are given as hexadecimal RGB color codes.
- Parameters:
session (
Session) – the session for which the data should be obtained- Return type:
dict[str,str]- Returns:
dictionary mapping compound names to RGB hex colors
- fastf1.plotting.get_driver_abbreviation(identifier, session, *, exact_match=False)[source]
Get a driver’s abbreviation based on a recognizable and identifiable part of the driver’s name.
Note that the driver’s abbreviation, if given exactly, is also a valid identifier. In this case the same value is returned as was given as the identifier.
- Parameters:
identifier (
str) – recognizable part of the driver’s name (or the driver’s abbreviation)session (
Session) – the session for which the data should be obtainedexact_match (
bool) – match the identifier exactly (case-insensitive, special characters are converted to their nearest ASCII equivalent)
- Return type:
str
- fastf1.plotting.get_driver_abbreviations_by_team(identifier, session, *, exact_match=False)[source]
Get a list of abbreviations of all drivers that drove for a team in a given session based on a recognizable and identifiable part of the team name.
- Parameters:
identifier (
str) – a recognizable part of the team namesession (
Session) – the session for which the data should be obtainedexact_match (
bool) – match the identifier exactly (case-insensitive, special characters are converted to their nearest ASCII equivalent)
- Return type:
list[str]
- fastf1.plotting.get_driver_color(identifier, session, *, colormap='default', exact_match=False)[source]
Get the color that is associated with a driver based on the driver’s abbreviation or based on a recognizable and identifiable part of the driver’s name.
Note
This will simply return the team color of the team that the driver participated for in this session. Contrary to older versions of FastF1, there are no separate colors for each driver. You should use styling options other than color if you need to differentiate drivers of the same team. The function
get_driver_style()can help you to customize the plot styling for each driver.- Parameters:
identifier (
str) – driver abbreviation or recognizable part of the driver namesession (
Session) – the session for which the data should be obtainedcolormap (
str) – one of'default','fastf1'or'official'. The default colormap is'fastf1'. Useset_default_colormap()to change it.exact_match (
bool) – match the identifier exactly (case-insensitive, special characters are converted to their nearest ASCII equivalent)
- Return type:
str- Returns:
A hexadecimal RGB color code
- fastf1.plotting.get_driver_color_mapping(session, *, colormap='default')[source]
Returns a dictionary that maps driver abbreviations to their associated colors. The colors are given as hexadecimal RGB color codes.
- Parameters:
session (
Session) – the session for which the data should be obtainedcolormap (
str) – one of'default','fastf1'or'official'. The default colormap is'fastf1'. Useset_default_colormap()to change it.
- Return type:
dict[str,str]- Returns:
dictionary mapping driver abbreviations to RGB hex colors
- fastf1.plotting.get_driver_name(identifier, session, *, exact_match=False)[source]
Get a full driver name based on the driver’s abbreviation or based on a recognizable and identifiable part of the driver’s name.
- Parameters:
identifier (
str) – driver abbreviation or recognizable part of the driver namesession (
Session) – the session for which the data should be obtainedexact_match (
bool) – match the identifier exactly (case-insensitive, special characters are converted to their nearest ASCII equivalent)
- Return type:
str
- fastf1.plotting.get_driver_names_by_team(identifier, session, *, exact_match=False)[source]
Get a list of full names of all drivers that drove for a team in a given session based on a recognizable and identifiable part of the team name.
- Parameters:
identifier (
str) – a recognizable part of the team namesession (
Session) – the session for which the data should be obtainedexact_match (
bool) – match the identifier exactly (case-insensitive, special characters are converted to their nearest ASCII equivalent)
- Return type:
list[str]
- fastf1.plotting.get_driver_style(identifier, style, session, *, colormap='default', additional_color_kws=(), exact_match=False)[source]
Get a plotting style that is unique for a driver based on the driver’s abbreviation or based on a recognizable and identifiable part of the driver’s name.
This function simplifies the task of generating unique and easily distinguishable visual styles for multiple drivers in a plot. Primarily, the focus is on plotting with Matplotlib, but it is possible to customize the behaviour for compatibility with other plotting libraries.
The general idea for creating visual styles is as follows:
Set the primary color of the style to the color of the team for which a driver is driving. This may be the line color in a line plot, the marker color in a scatter plot, and so on.
Use one or multiple other styling options (line style, markers, …) to differentiate drivers in the same team.
Note
It cannot be guaranteed that the styles are consistent throughout a full season, especially in case of driver changes within a team.
Option 1: Rely on built-in styling options
By default, this function supports the following Matplotlib plot arguments:
linestyle,marker,color,facecolor,edgecoloras well as almost all other color-related arguments.The styling options include one color for each team and up to four different line styles and marker styles within a team. That means that no more than four different drivers are supported for a team in a single session. This should be sufficient in almost all scenarios.
The following example obtains the driver style for Alonso and Stroll in a race in the 2023 season. The drivers should be represented using the
colorandmarkerarguments, as may be useful in a scatter plot. Both drivers were driving for the Aston Martin team, therefore, both automatically get assigned the same color, which is the Aston Martin team color. But both drivers get assigned a different marker style, so they can be uniquely identified in the plot.Example:
>>> from fastf1 import get_session
>>> from fastf1.plotting import get_driver_style
>>> session = get_session(2023, 10, 'R')
>>> get_driver_style('ALO', ['color', 'marker'], session)
{'color': '#00665e', 'marker': 'x'}
>>> get_driver_style('STR', ['color', 'marker'], session)
{'color': '#00665e', 'marker': 'o'}
Option 2: Provide a custom list of styling variants
To allow for almost unlimited styling options, it is possible to specify custom styling variants. These are not tied to any specific plotting library.
In the following example, a list with two custom styles is defined that are then used to generate driver specific styles. Each style is represented by a dictionary of keywords and values.
The first driver in a team gets assigned the first style, the second driver the second style and so on (if there are more than two drivers). It is necessary to define at least as many styles as there are drivers in a team.
The following things need to be noted:
1. The notion of first or second driver does not refer to any particular reference and no specific order for drivers within a team is intended or guaranteed.
2. Any color-related key can make use of the “magic”
'auto'value as shown with Alonso in this example. When the color value is set to'auto'it will automatically be replaced with the team color for this driver. All color keywords that are used in Matplotlib should be recognized automatically. You can define custom arguments as color arguments through theadditional_color_kwsargument. The replacement is done recursively so it will also work if your custom style dictionaries contain nested dictionaries as values.3. Each style dictionary can contain arbitrary keys and value. Therefore, you are not limited to any particular plotting library.
Example:
>>> from fastf1 import get_session
>>> from fastf1.plotting import get_driver_style
>>> session = get_session(2023, 10, 'R')
>>> my_styles = [
...     {'linestyle': 'solid', 'color': 'auto', 'custom_arg': True},
...     {'linestyle': 'dotted', 'color': '#FF0060', 'other_arg': 10}
... ]
>>> get_driver_style('ALO', my_styles, session)
{'linestyle': 'solid', 'color': '#00665e', 'custom_arg': True}
>>> get_driver_style('STR', my_styles, session)
{'linestyle': 'dotted', 'color': '#FF0060', 'other_arg': 10}
- Parameters:
identifier (
str) – driver abbreviation or recognizable part of the driver namestyle (
Union[str,Sequence[str],Sequence[dict]]) – list of matplotlib plot arguments that should be used for styling or a list of custom style dictionariessession (
Session) – the session for which the data should be obtainedcolormap (
str) – one of'default','fastf1'or'official'. The default colormap is'fastf1'. Useset_default_colormap()to change it.additional_color_kws (
Union[list,tuple]) – A list of keys that should additionally be treated as colors. This is most useful for making the magic'auto'color work with custom styling options.exact_match (
bool) – match the identifier exactly (case-insensitive, special characters are converted to their nearest ASCII equivalent)
- Return type:
dict[str,Any]
- Returns: a dictionary of plot style arguments that can be directly passed
to a matplotlib plot function using the
**expansion operator
Examples using
fastf1.plotting.get_driver_style
- fastf1.plotting.get_team_color(identifier, session, *, colormap='default', exact_match=False)[source]
Get a team color based on a recognizable and identifiable part of the team name.
The team color is returned as a hexadecimal RGB color code.
- Parameters:
identifier (
str) – a recognizable part of the team namesession (
Session) – the session for which the data should be obtainedcolormap (
str) – one of'default','fastf1'or'official'. The default colormap is'fastf1'. Useset_default_colormap()to change it.exact_match (
bool) – match the identifier exactly (case-insensitive, special characters are converted to their nearest ASCII equivalent)
- Return type:
str- Returns:
A hexadecimal RGB color code
- fastf1.plotting.get_team_name(identifier, session, *, short=False, exact_match=False)[source]
Get a full or shortened team name based on a recognizable and identifiable part of the team name.
The short version of the team name is intended for saving space when annotating plots and may skip parts of the official team name, for example “Haas F1 Team” becomes just “Haas”.
- Parameters:
identifier (
str) – a recognizable part of the team namesession (
Session) – the session for which the data should be obtainedshort (
bool) – if True, a shortened version of the team name will be returnedexact_match (
bool) – match the identifier exactly (case-insensitive, special characters are converted to their nearest ASCII equivalent)
- Return type:
str
- fastf1.plotting.get_team_name_by_driver(identifier, session, *, short=False, exact_match=False)[source]
Get a full team name based on a driver’s abbreviation or based on a recognizable and identifiable part of a driver’s name.
Alternatively, a shortened version of the team name can be returned. The short version is intended for saving as much space as possible when annotating plots and may skip parts of the official team name.
- Parameters:
identifier (
str) – driver abbreviation or recognizable part of the driver namesession (
Session) – the session for which the data should be obtainedshort (
bool) – if True, a shortened version of the team name will be returnedexact_match (
bool) – match the identifier exactly (case-insensitive, special characters are converted to their nearest ASCII equivalent)
- Return type:
str
- fastf1.plotting.list_compounds(session)[source]
Returns a list of all compound names for this season (not session).
- Return type:
list[str]
- fastf1.plotting.list_driver_abbreviations(session)[source]
Returns a list of abbreviations of all drivers in the
session.- Return type:
list[str]
- fastf1.plotting.list_driver_names(session)[source]
Returns a list of full names of all drivers in the
session.- Return type:
list[str]
- fastf1.plotting.list_team_names(session, *, short=False)[source]
Returns a list of team names of all teams in the
session.By default, the full team names are returned. Use the
shortargument to get shortened versions of the team names instead.- Parameters:
session (
Session) – the session for which the data should be obtainedshort (
bool) – if True, a list of the shortened team names is returned
- Return type:
list[str]- Returns:
a list of team names
- fastf1.plotting.override_team_constants(identifier, session, *, short_name=None, official_color=None, fastf1_color=None)[source]
Override the default team constants for a specific team.
This function is intended for advanced users who want to customize the default team constants. The changes are only applied for the current session and do not persist.
- Parameters:
identifier (
str) – A part of the team name. Note that this function does not support fuzzy matching and will raise aKeyErrorif no exact and unambiguous match is found!session (
Session) – The session for which the override should be appliedshort_name (
Optional[str]) – New value for the short name of the teamofficial_color (
Optional[str]) – New value for the team color in the “official” color map; must be a hexadecimal RGB color codefastf1_color (
Optional[str]) – New value for the team color in the “fastf1” color map; must be a hexadecimal RGB color code
- fastf1.plotting.set_default_colormap(colormap)[source]
Set the default colormap that is used for color lookups.
- Parameters:
colormap (
str) – one of'fastf1'or'official'
- fastf1.plotting.setup_mpl(mpl_timedelta_support=True, color_scheme=None, *args, **kwargs)[source]
Setup matplotlib for use with fastf1.
This is optional but, at least partly, highly recommended.
- Parameters:
mpl_timedelta_support (bool) –
Matplotlib itself offers very limited functionality for plotting timedelta values. (Lap times, sector times and other kinds of time spans are represented as timedelta.)
Enabling this option will patch some internal matplotlib functions and register converters, formatters and locators for tick formatting. The heavy lifting for this is done by an external package called ‘Timple’. See https://github.com/theOehrly/Timple if you wish to customize the tick formatting for timedelta.
color_scheme (str, None) – This enables the Fast-F1 color scheme that you can see in all example images. Valid color scheme names are: [‘fastf1’, None]