Note
Go to the end to download the full example code.
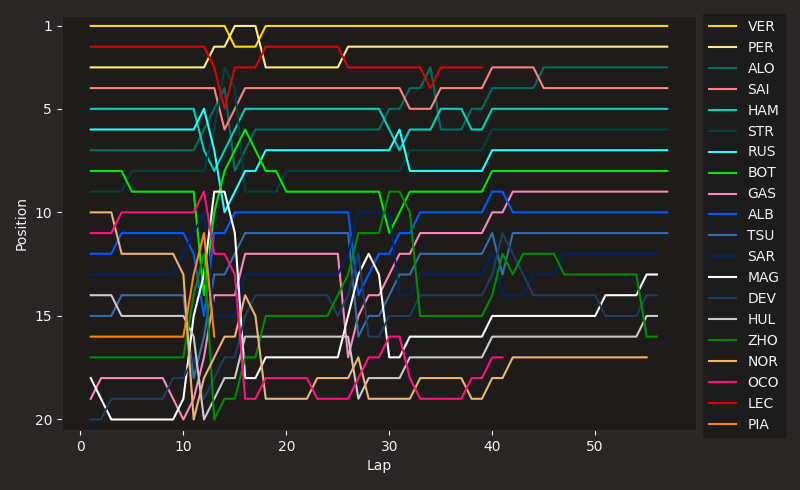
Position changes during a race
Plot the position of each driver at the end of each lap.
import matplotlib.pyplot as plt

import fastf1.plotting


# Load FastF1's dark color scheme
fastf1.plotting.setup_mpl(mpl_timedelta_support=False, color_scheme='fastf1')
Load the session and create the plot
session = fastf1.get_session(2023, 1, 'R')
session.load(telemetry=False, weather=False)

fig, ax = plt.subplots(figsize=(8.0, 4.9))
For each driver, get their three letter abbreviation (e.g. ‘HAM’) by simply using the value of the first lap, get their color and then plot their position over the number of laps.
for drv in session.drivers:
    drv_laps = session.laps.pick_drivers(drv)

    abb = drv_laps['Driver'].iloc[0]
    style = fastf1.plotting.get_driver_style(identifier=abb,
                                             style=['color', 'linestyle'],
                                             session=session)

    ax.plot(drv_laps['LapNumber'], drv_laps['Position'],
            label=abb, **style)
Finalize the plot by setting y-limits that invert the y-axis so that position one is at the top, set custom tick positions and axis labels.
ax.set_ylim([20.5, 0.5])
ax.set_yticks([1, 5, 10, 15, 20])
ax.set_xlabel('Lap')
ax.set_ylabel('Position')
Text(0, 0.5, 'Position')
Because this plot is very crowed, add the legend outside the plot area.
ax.legend(bbox_to_anchor=(1.0, 1.02))
plt.tight_layout()

plt.show()
Total running time of the script: (0 minutes 1.965 seconds)